shizzle787
King Shizzle DCCLXXXVII of the Cesspool
- Joined
- Oct 19, 2015
- Messages
- 12,918
- Reaction Score
- 22,704
To be clear: I calculated these based off of the adjusted efficiency margin. It was a simple analysis: I added up the AEM of each team in a league and divided by the total number of teams. I'm too cheap to buy KenPom so I don't know if he does this but I did it anyway. It is not perfect: I likely made a computational error along the way, and there are other variables that may invalidate this. However, I think it is pretty accurate and there a few very interesting results (especially in mid-major land).
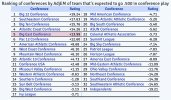
Without further ado, here are the rankings (league avg. AEM in parenthesis)
Tier 1
1. Big 12 (19.19)
2. SEC (17.83)
3. Big 10 (15.57)
4. ACC (14.53)
5. Big East (13.80)
6. Pac-12 (12.12)
Tier 2
7. AAC (8.63)
8. WCC (7.07)
9. MW (6.09)
10. A-10 (5.09)
Tier 3
11. C-USA (2.55)
12. MVC (.60)
13. WAC (-.94)
14. Southern (-1.1)
Tier 4
15. Big West (-3.12)
16. Sun Belt (-3.24)
17. Ivy (-3.81)
18. MAC (-4.13)
Tier 5
19. MAAC (-5.05)
20. A-Sun (-5.35)
21. Big South (-5.51)
22. CAA (-5.53)
23. Summit (-6.00)
Tier 6
24. Patriot (-7.44)
25. Big Sky (-7.55)
26. America East (-7.76)
27. Horizon (-8.84)
Tier 7
28. MEAC (-11.63)
29. OVC (-11.85)
Tier 8
30. NEC (-14.31)
31. Southland (-14.33)
32. SWAC (-15.01)
33. Indies (-19.23)
To me the biggest surprises:
SEC in 2nd (higher than expected)
C-USA in 11th (higher than expected)
WAC in 13th (higher than expected)
Big West in 15th (higher than expected)
CAA in 22nd (lower than expected)