- Joined
- Feb 15, 2017
- Messages
- 662
- Reaction Score
- 4,277
Continuing a preliminary statistical comparison of the 2016-17 starting five with the starting five from other years. Here, we look at the 2014-15 starters. Again, the focus (legitimate or not) is on the starters, not the team as a whole.
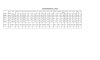
Here are the individual and collective key stats. for the starters:


Minutes
The 16-17 starters logged 192 more total minutes playing time than the 14-15 starters (about 3.5% more total minutes), despite playing two games less. Based on the minutes played, we can adjust when comparing other statistics by multiplying the 16-17 figures by 0.965.
If minutes logged is a measure of anything, then . . . Advantage: 16-17.
FG
The starters are pretty even here, though we should remember that the 14-15 starters achieved these numbers by logging less minutes—roughly equivalent of playing in about one entire game less. The 16-17 starters had slightly higher FG%. The 14-15 starters had more attempts and makes in less time. Advantage: 14-15.
3PG
Very similar to the above. Roughly equal 3PG%, with the 14-15 starters taking and hitting the shots a bit more frequently. Advantage: 14-15.
Free Throws
16-17 Starters got to the line 93 more times on the year, shot slightly better for an additional 106 makes. Adjusting for the difference in minutes played shows that the 16-17 starters still went to the line a lot more often than 14-15 starters. Advantage: 16-17.
Points
Again, the numbers are close. 16-17 starters lead in absolute terms (2,738 vs. 2,697). Adjusting for minutes played, puts the two groups virtually dead even. Advantage: none.
Having so noted, the scoring among the 14-15 starters is more evenly distributed, with arguably better all around inside/outside options. All five starters average at least 10 points/game. It will be interesting to see if any UConn teams has ever had five starters do that on the year.
Rebounds
Absolute numbers favor 16-17. Adjusted still favors 16-17 slightly. But the 14-15 starters are arguably more balanced. Moriah and Saniya basically cancel each other out (given the adjustment for playing time). Collier soundly outrebounded her 14-15 counterpart, Tuck. Gabby (as a junior) outrebounded Stewie (as a junior), in absolute terms and adjusted for playing time. 14-15 Kia outrebounded 16-17 Kia, absolutely and adjusted. I’d give the nod to KML over KLS; in less playing time KML had almost twice as many ORebs, and only six less DRebs. Slight Advantage: 14-15.
Assists
Again, the numbers are very close. Adjusting for minutes played gives the 14-15 starters a negligible numerical advantage. Comparable balance. Moriah (14-15) and Gabby (16-17) had 190 and 191 assists, respectively. Advantage: none.
Turnovers
The 16-17 starters turned the ball over less. Even adjusting for minutes played, 14-15 turned the ball over 37 more times, about once per game more. Advantage: 16-17.
Steals
The numbers are very close, and when adjusting for minutes played result in almost identical figures (about 290). Advantage: none.
Blocks
16-17 leads, with and without adjustment. But Stewie’s 14-15 numbers distort the result. That is not a criticism. Number of blocks are not especially meaningful on their own. What they reflect is a shot taken that may or may not have gone in. What they mean is a defensive presence that must be reckoned with. Who would you rather go against: Stewie, or Phee/Gabby? Advantage: ???
PF
Close. When applying the adjustment, the 16-17 starters fouled less. Slight advantage: 16-17.
Conclusion
I think these stats (though threadbare for the purposes) give the advantage to the 14-15 starters, particularly in light of the most significant categories (points and rebounds). Where the 16-17 starters get the edge, it is not by much and/or in areas that are not as meaningful to outcome (minutes, FTs, TOs).
Thoughts? Observations?
FN. Gabby watch. Having now looked at the numbers for the starters over the past 3 seasons, I am becoming increasingly amazed at the year Gabby had in 16-17. Consider this:
· Gabby averaged 14.3 points/game.
· Gabby lead her team in steals and assists, and was barely second in ORebs, DRebs, and total Rebs for the year. Adjusted for playing time, she tied Phees for team lead in ORebs;
· Gabby’s team-leading 190 assists in 16-17 was one less than Moriah’s team-leading 191 assists in 14-15;
· Gabby’s team-leading 100 steals in 16-17 tied Moriah’s team-leading 100 steals in 14-15;
· Gabby’s ORebs (104) and total Rebs (309) was more than Stewie’s in 14-15, despite less playing time;
· Gabby’s 16-17 per game averages: 14.3 points; 8.4 Rebs; 5.1 assists; 2.7 steals; 1.4 blocks.
It is inconceivable that she was not named an All-American. Not to take anything away from KLS, but Gabby averaged only 6 points less per game; had more than twice as many Rebs (309 to 143), 72 more assists (190 to 118); almost twice as many steals (110 to 56); and five times as many blocks (52 to 10). This was accomplished with 103 fewer playing minutes--roughly the equivalent of playing 2.5 fewer games.
Here are the individual and collective key stats. for the starters:
Minutes
The 16-17 starters logged 192 more total minutes playing time than the 14-15 starters (about 3.5% more total minutes), despite playing two games less. Based on the minutes played, we can adjust when comparing other statistics by multiplying the 16-17 figures by 0.965.
If minutes logged is a measure of anything, then . . . Advantage: 16-17.
FG
The starters are pretty even here, though we should remember that the 14-15 starters achieved these numbers by logging less minutes—roughly equivalent of playing in about one entire game less. The 16-17 starters had slightly higher FG%. The 14-15 starters had more attempts and makes in less time. Advantage: 14-15.
3PG
Very similar to the above. Roughly equal 3PG%, with the 14-15 starters taking and hitting the shots a bit more frequently. Advantage: 14-15.
Free Throws
16-17 Starters got to the line 93 more times on the year, shot slightly better for an additional 106 makes. Adjusting for the difference in minutes played shows that the 16-17 starters still went to the line a lot more often than 14-15 starters. Advantage: 16-17.
Points
Again, the numbers are close. 16-17 starters lead in absolute terms (2,738 vs. 2,697). Adjusting for minutes played, puts the two groups virtually dead even. Advantage: none.
Having so noted, the scoring among the 14-15 starters is more evenly distributed, with arguably better all around inside/outside options. All five starters average at least 10 points/game. It will be interesting to see if any UConn teams has ever had five starters do that on the year.
Rebounds
Absolute numbers favor 16-17. Adjusted still favors 16-17 slightly. But the 14-15 starters are arguably more balanced. Moriah and Saniya basically cancel each other out (given the adjustment for playing time). Collier soundly outrebounded her 14-15 counterpart, Tuck. Gabby (as a junior) outrebounded Stewie (as a junior), in absolute terms and adjusted for playing time. 14-15 Kia outrebounded 16-17 Kia, absolutely and adjusted. I’d give the nod to KML over KLS; in less playing time KML had almost twice as many ORebs, and only six less DRebs. Slight Advantage: 14-15.
Assists
Again, the numbers are very close. Adjusting for minutes played gives the 14-15 starters a negligible numerical advantage. Comparable balance. Moriah (14-15) and Gabby (16-17) had 190 and 191 assists, respectively. Advantage: none.
Turnovers
The 16-17 starters turned the ball over less. Even adjusting for minutes played, 14-15 turned the ball over 37 more times, about once per game more. Advantage: 16-17.
Steals
The numbers are very close, and when adjusting for minutes played result in almost identical figures (about 290). Advantage: none.
Blocks
16-17 leads, with and without adjustment. But Stewie’s 14-15 numbers distort the result. That is not a criticism. Number of blocks are not especially meaningful on their own. What they reflect is a shot taken that may or may not have gone in. What they mean is a defensive presence that must be reckoned with. Who would you rather go against: Stewie, or Phee/Gabby? Advantage: ???
PF
Close. When applying the adjustment, the 16-17 starters fouled less. Slight advantage: 16-17.
Conclusion
I think these stats (though threadbare for the purposes) give the advantage to the 14-15 starters, particularly in light of the most significant categories (points and rebounds). Where the 16-17 starters get the edge, it is not by much and/or in areas that are not as meaningful to outcome (minutes, FTs, TOs).
Thoughts? Observations?
FN. Gabby watch. Having now looked at the numbers for the starters over the past 3 seasons, I am becoming increasingly amazed at the year Gabby had in 16-17. Consider this:
· Gabby averaged 14.3 points/game.
· Gabby lead her team in steals and assists, and was barely second in ORebs, DRebs, and total Rebs for the year. Adjusted for playing time, she tied Phees for team lead in ORebs;
· Gabby’s team-leading 190 assists in 16-17 was one less than Moriah’s team-leading 191 assists in 14-15;
· Gabby’s team-leading 100 steals in 16-17 tied Moriah’s team-leading 100 steals in 14-15;
· Gabby’s ORebs (104) and total Rebs (309) was more than Stewie’s in 14-15, despite less playing time;
· Gabby’s 16-17 per game averages: 14.3 points; 8.4 Rebs; 5.1 assists; 2.7 steals; 1.4 blocks.
It is inconceivable that she was not named an All-American. Not to take anything away from KLS, but Gabby averaged only 6 points less per game; had more than twice as many Rebs (309 to 143), 72 more assists (190 to 118); almost twice as many steals (110 to 56); and five times as many blocks (52 to 10). This was accomplished with 103 fewer playing minutes--roughly the equivalent of playing 2.5 fewer games.